Features

Map
In the Map module, users can choose a species and then browse a variety of related genomic tracks, such as reference sequences, RPM coverage and DANPOS/iNPS called nucleosome peaks, in the interactive genome browser based on JBrowse .
In addition, users can directly go to browse their interested genes using the built-in search functionality (see the images below).
-
Click the genomic range box to make it input-capable.
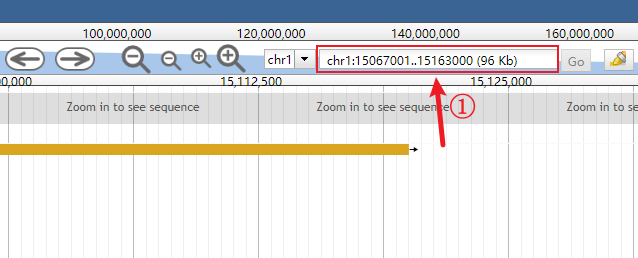
-
Clear the genomic range box.
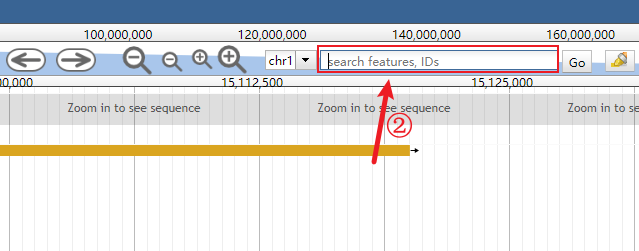
-
Input the interested gene (the auto-completion is enabled).
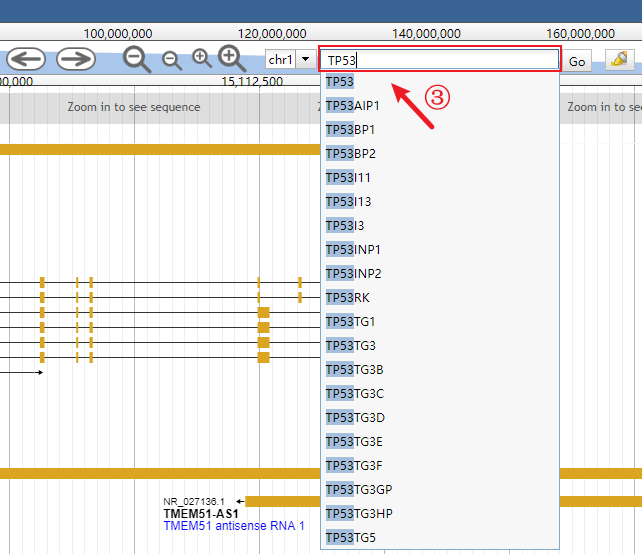
-
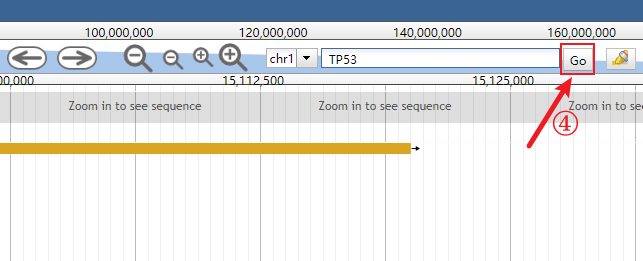
Click the Go button or simply press the Enter key.
Transcription factor binding sites
In the TFBSs resource module, users can browse potential transcription factor binding sites (TFBSs) found by FIMO .
Enrichment analysis
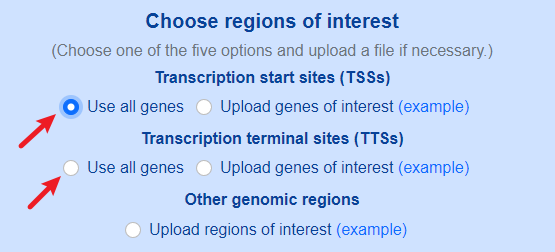
In the Enrichment Analysis module, users can perform enrichment analysis on at most 10 selected samples.
Both default genomic sites (TSSs and TTSs) and custom genomic sites are supported.
-
Use default genomic sites.
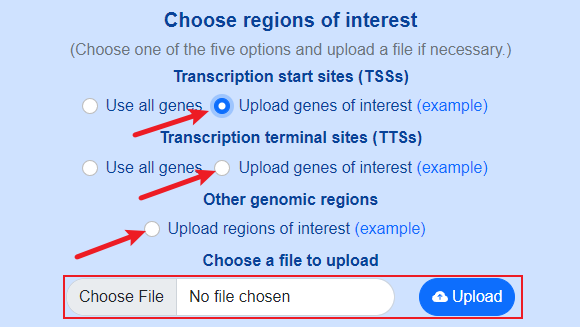
-
Use custom genomic sites.
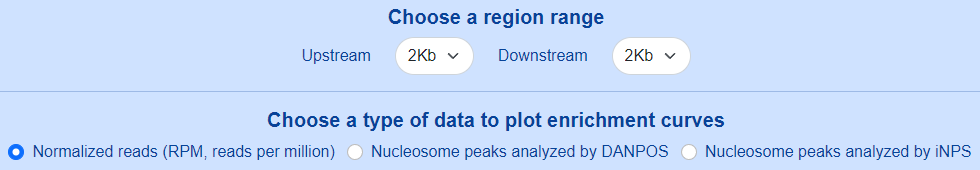
Users can set the region range around selected genomic sites from -5Kb to +5Kb, and choose a type of data to plot enrichment curves.
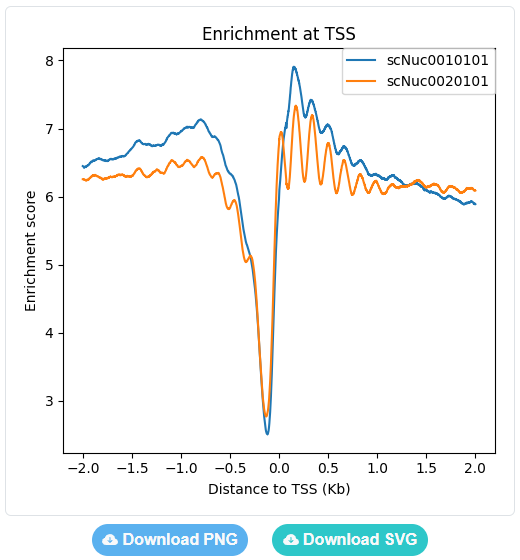
The enrichment curves are displayed directly in the page and can be downloaded as either a PNG image or a SVG image.
Comparative analysis
In the Comparative Analysis module, users can perform comparative analysis on two selected samples. All nucleosomes within ±2Kb around all TSSs between two samples are compared.
The time consumption is usually less than 4 minutes, depending on the number of transcripts of the species.
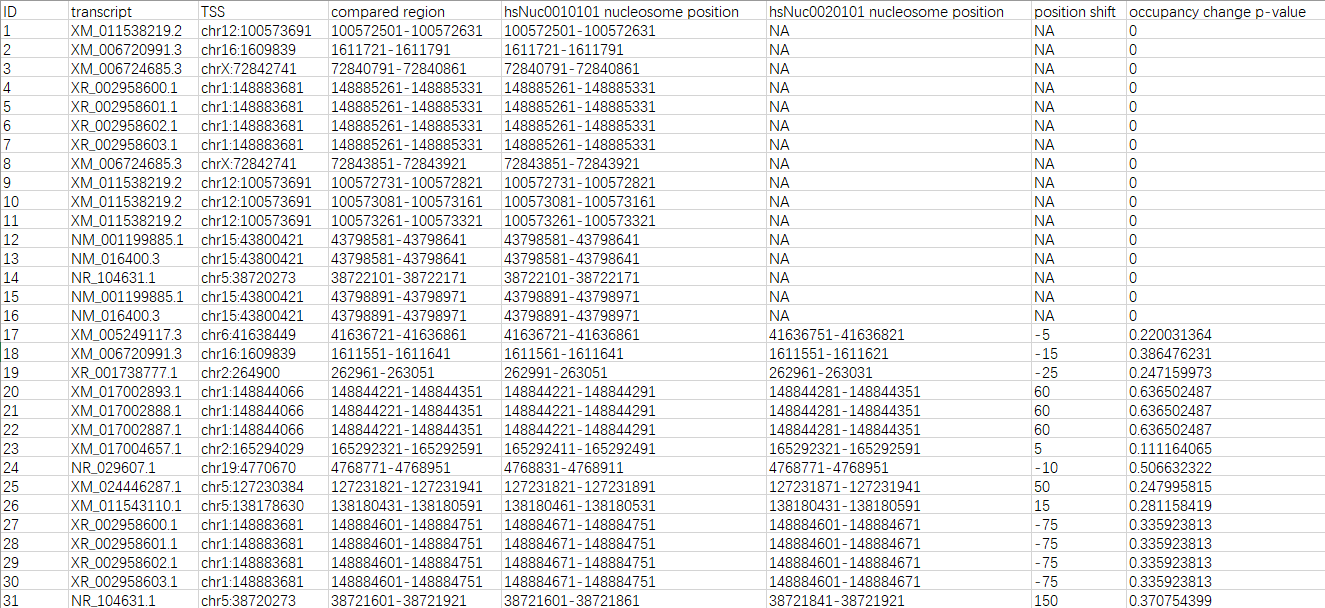
The analysis result can be downloaded as a CSV file. There are 8 fields in the file (see the descriptions and the example below).
- ID: the unique identifers of each comparison
- transcript: the transcript accessions
- TSS: the genomic positions of each TSS
- compared region: the genomic ranges of each comparison
- [reference sample ID] nucleosome position: the genomic ranges of compared nucleosomes in the reference sample
- [alternative sample ID] nucleosome position: the genomic range of compared nucleosomes in the alternative sample
- position shift: the dyad (center) positions of alternative nucleosomes minus the dyad (center) positions of reference nucleosomes
- occupancy change p-value: the p-values of Mann-Whitney U tests on the occupancy signals of alternative nucleosomes and reference nucleosomes
FAQ
What is NucMap database?
NucMap is a database of genome-wide nucleosome positioning map across species. It is dedicated to collecting, analyzing and storing nucleosome positioning data in all organisms. NucMap provides services on querying and visualizing nucleosome positioning information at single nucleotide resolution. Meanwhile, it also provides some analysis of enrichment analysisand difference on interested genes or samples.
How to search samples?
In Home page, user can fill in the entry of interested key in the input box to search and view the corresponding data and information about Species, Sample, Gene or Transcript. Or in the "Sample" page, user can browse sample list by searching with keywords about species, sample material or assay. All raw data in NucMap database were collected from GEO and ENCODE database. Accession id in GEO can also be used to narrow down sample list.
Naming convention of sample accessions
There are two sample accession naming conventions in NucMap.
For samples collected in NucMap version 1, their accessions are formatted into five naming parts, i.e., ** Nuc *** ** **.
- The first naming part represents the species name. The first letter in this part represents the first letter of the first word of the species name, and the second letter in this part represents the first letter of the second word of the species name, e.g., hs represents Homo sapiens.
- The second naming part (Nuc) represents NucMap.
- The third naming part is used to number the biological samples or materials. If more than one sample from the same species has the same third naming part, it means that they are from the same or similar biological sample or material.
- The fourth naming part is used to number the experimental treatment. Different fourth naming parts mean that different experimental treatment was applied on the same biological sample or material, such as different concentration of MNase, different time of digestion or different antibodies.
- The last naming part is used to number technical replicates.
For samples collected in NucMap version 2, their accessions are formatted into three naming parts, i.e., *** Nuc *******.
- The first naming part represents the species name. The first letter in this part represents the first letter of the first word of the species name, and the last two letters in this part represent the first two letters of the second word of the species name, e.g., hsa represents Homo sapiens.
- The second naming part (Nuc) represents NucMap.
- The last naming part is used to number the samples from the same species.
What is nucleosome browser?
Nucleosome browser is an interactive browser built to visualize nucleosome positioning information in NucMap. It was developed based on JBrowse. For each species, tracks for raw reads signal and analyzed nucleosome peaks are available for all samples. Users can choose their interested tracks and view any regions across whole genome.
Analyses in NucMap database
With analysis modules in NucMap, users can analyze nucleosome enrichment at transcription start site (TSS) across samples or different interested gene groups. Both heatmap and enrichment curve are available in the analysis module.
Since NucMap version 2, using the "Comparative Analysis" sub-module of "Analysis", users can analyze differential nucleosome regions (DNRs) between two samples belonging to a same species. The results can be downloaded as a CSV file.
Restrictions on gene names
Generally, there are no restrictions on the interested gene names. However, it is very tricky in what kind of names to use. Enrichment analysis mainly focus on nucleosome density around transcription start sites(TSSs). Typically, one gene may have multiple transcripts with different TSSs. If gene names are used, such as Tp53, Med14 and so on, the most upstream TSS will be used in the enrichment analysis. If users want to check some specific TSSs, it will be better to use transcript names rather than gene names. If some transcript names or gene names do not match the names in NucMap database, a warning will be added to the page.
Format of user-defined genes
User-defined genes should be described in a two-column tab-separated text file.
- The first column should be gene names or transcript names.
- The second column is optional, and should be group names used to classify genes or transcripts into different groups. The group names are up to users' purpose, and they could be “high expressed gene”, “low expressed gene”, “housekeeping gene” and so on. If the second column is not provided, all genes or transcripts will be treated as the same group.
Format of user-defined genomic regions
User-defined genomic regions should be described in a BED-like file. The main difference between the NucMap-required format and the standard BED format is that the 4th column should be group names used to classify genomic regions into different groups. In each file, at most 6 different group names are allowed. According to the strand, the center position will be used and extended by the size defined by the region range in the server-side computation. There are three valid formats (see the examples below).
-
Standard BED format.
											chr1 3451234 3459876 group1 0 +

											chr2 1242357 1248769 group1 0 +

											chr4 6548912 6550123 group2 0 +

chr2 3251945 3254589 group3 0 + -
The 5th and the 6th column are not provided. All strands will be treated as "+".
											chr1 3451234 3459876 group1

											chr2 1242357 1248769 group1

											chr4 6548912 6550123 group2

chr2 3251945 3254589 group3 -
Only the first three columns are provided. All regions will be treated as
“default_group” and all strands will be treated as "+".
											chr1 3451234 3459876

											chr4 6548912 6550123

											chr2 3251945 3254589

											chr2 1242357 1248769
Reference assembly versions
Please refer to the table displayed in the Species resource module.
Data processing pipeline
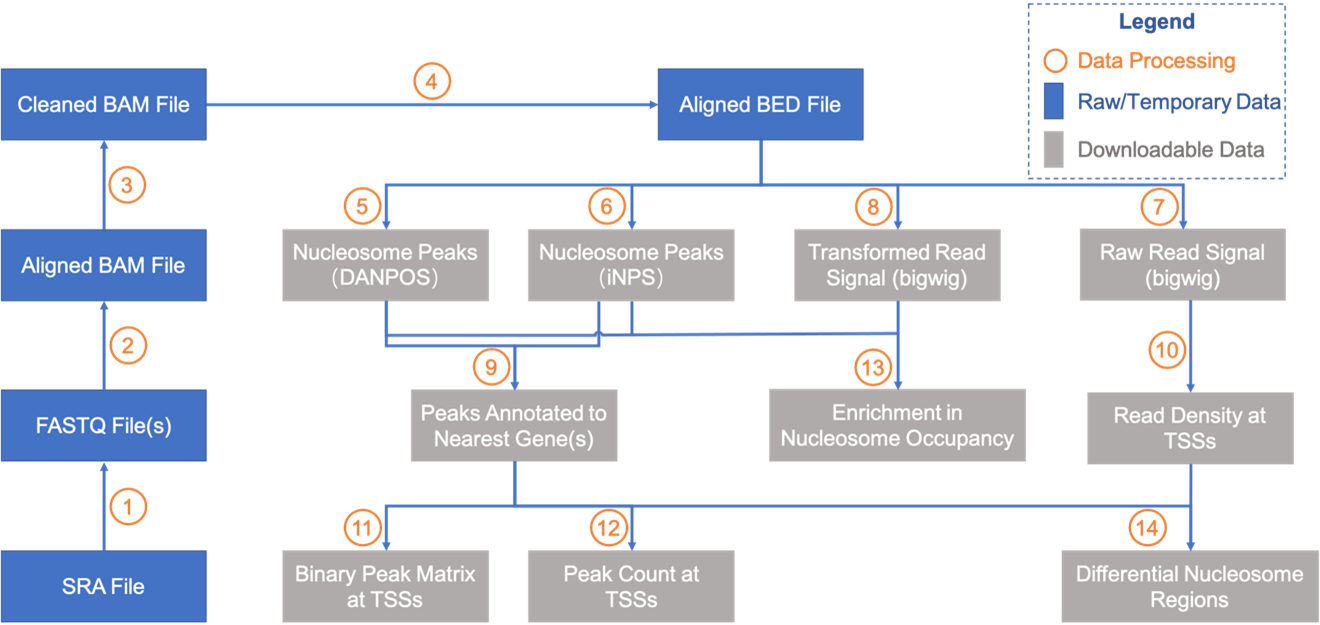
Details for data processing in each step:
- SRA data were converted into FASTQ data with fastq-dump (SRA Toolkit 2.10.9).
- MNase-seq data were aligned to their corresponding reference genome with BWA 0.7.10.
- Remove potential multiple alignments by removing entries with MAPQ < 10 and remove duplicates with Picard 2.22.8.
- Convert BAM file to BED file with BEDTools 2.28.
- Call nucleosome peaks with DNAPOS 3.
- Call nucleosome peaks with iNPS 1.2.2.
- Convert BED file into bigwig file with bedGraphToBigWig (UCSC utilities) and BEDTools. Reads count was normalized to reads per million (RPM).
- Extend all reads toward 3' end and artificially adjust each read length to 73 bp, and then convert the BED file into bigwig file. There is the "ext73bp" as marker in the filenames; Shift all extended reads toward 3' end by 73 bp to increase signal-to-noise ratio, and then make bigwig file based on shifted locations. There is the "shift" as marker in the filenames. Reads count was normalized to reads per million (RPM).
- Annotate nucleosome peak to nearest gene (by searching nearest TSS) with customized Perl script.
- Calculate reads density at each TSS with bedtool and customized Perl script.
- Calculate binary peak matrix (whether peak covers specific position) at TSS with customized Perl script.
- Calculate peak count at each TSS with customized Perl script.
- Plot enriched signals of regions around all TSSs, TTSs or uploaded genomic regions across selected samples with customized Python scripts.
- "locally" use the Wilcoxon rank-sum test, also known as Mann-Whitney U test, as the statistic method to identity differential nucleosome regions (DNRs) between two samples belonging to a same species.