Introduction
1.1 Single-cell methylation sequencing
1.2 Challenge
Over the past years, the field of single-cell DNA methylation is on the rise with the continuously produced great amounts of data, which enhance our understanding of epigenetic research of rare cell types. However, there is hardly a professional database or platform to deeply integrate these sequencing data, which makes the integration between studies more difficult.
1.3 Mission
To provide the epigenetic research community with a unified data repository that enables data sharing across single cell methylation sequencing, we developed scMethBank, a public repository that integrates scBS-seq data and comprehensive metadata from GEO and DDBJ, based on a standardized and more effective pipeline. Visualization of sample methylation patterns in single base resolution and across projects are also provided. Besides, we also developed an online tool that visualizes single cell methylation status of a genomic region in a user-friendly manner.
Data process
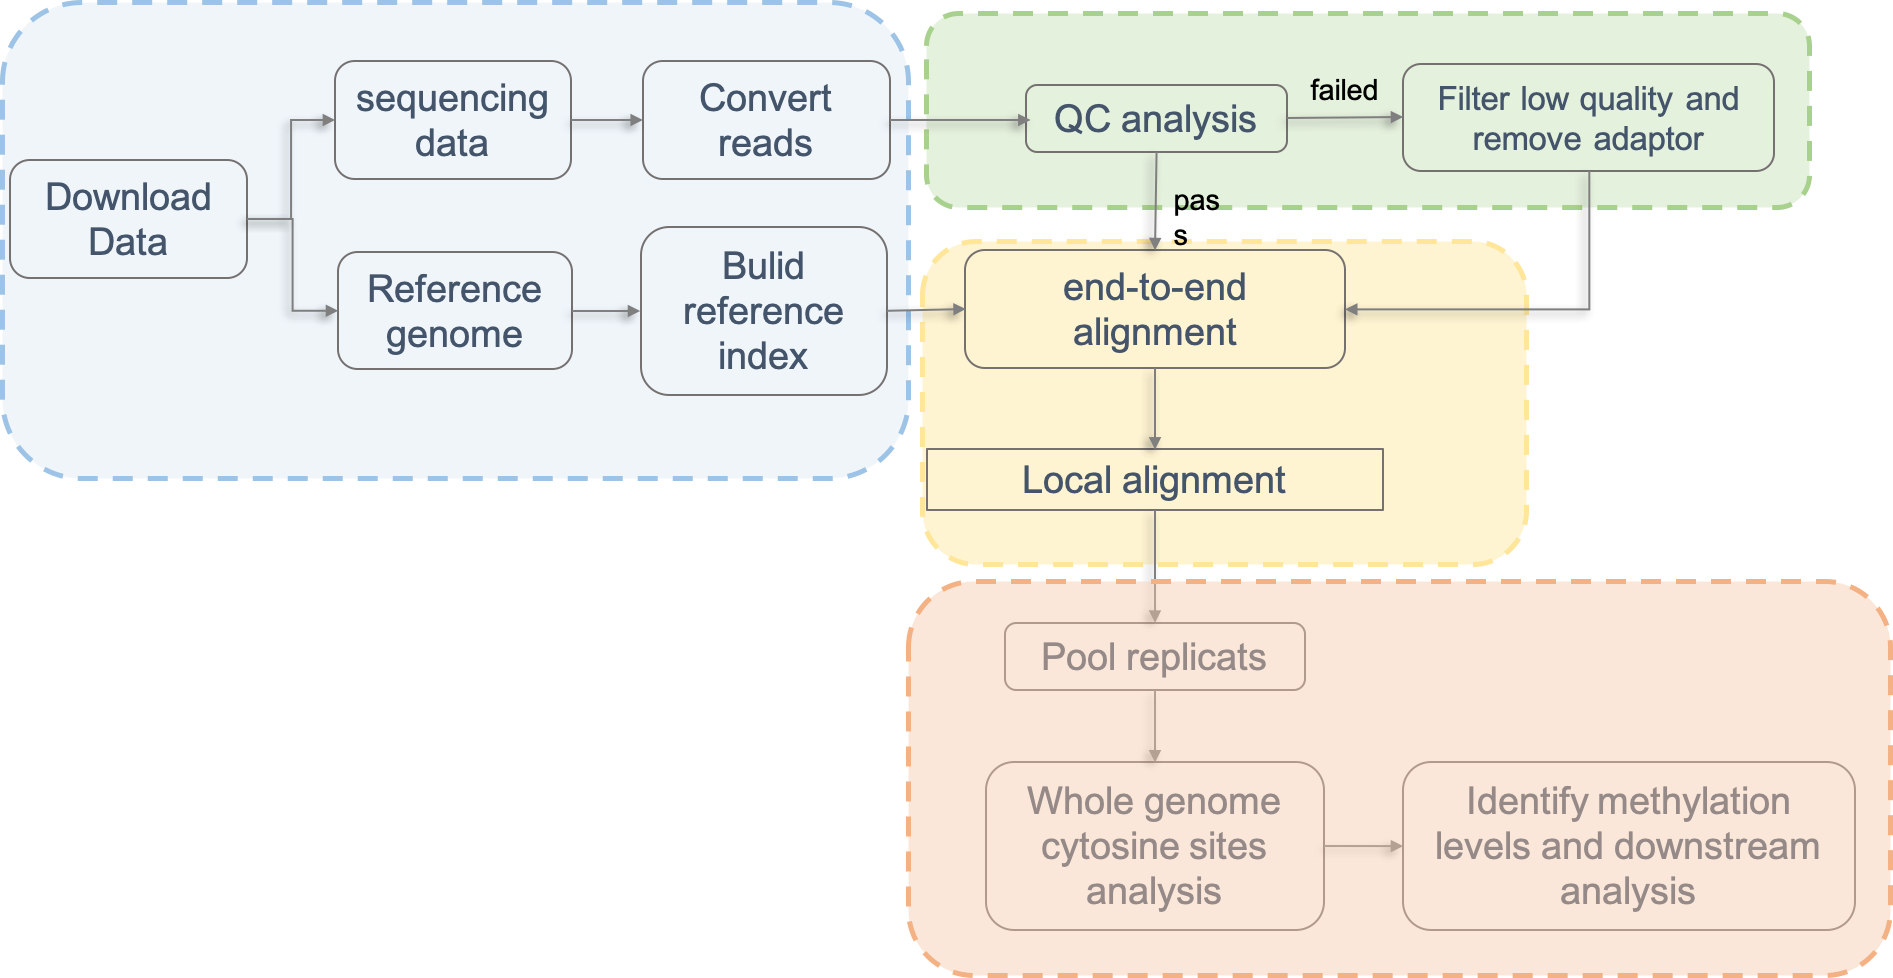
2.1 Data analysis
The read coverage threshold used to call the DNA methylation level for any cytosine was 1× for single-cell samples. Specifically, cytosine site is considered methylated with greater than 90% DNA methylation, whereas sites with less than 10% DNA methylation levels were considered unmethylated. All processed data were normalized to 0 and 1 with the same standard. After the methylation bed file is obtained, all subsequent steps including visualization and analysis were performed with customized R and Perl scripts.
2.2 Example:
| chr1 | G | 3000851 | CHH | CC | 0.1 | 1 | 10 |
| chr1 | C | 3001624 | CHG | CA | 0.0 | 0 | 9 |
| chr1 | C | 3001631 | CG | CG | 1.0 | 5 | 5 |
| chr1 | G | 3001632 | CG | CG | 0.9 | 9 | 10 |
2.3 Column Description

2.4 Metadata Curation
The descriptions of experimental variables are very different between studies, even for very common variables, which made integrating large amounts of metadata difficult. In order to better integrate this information and provide supports for data analysis of different projects, we unified some fields and deleted some fields.
Database Usage
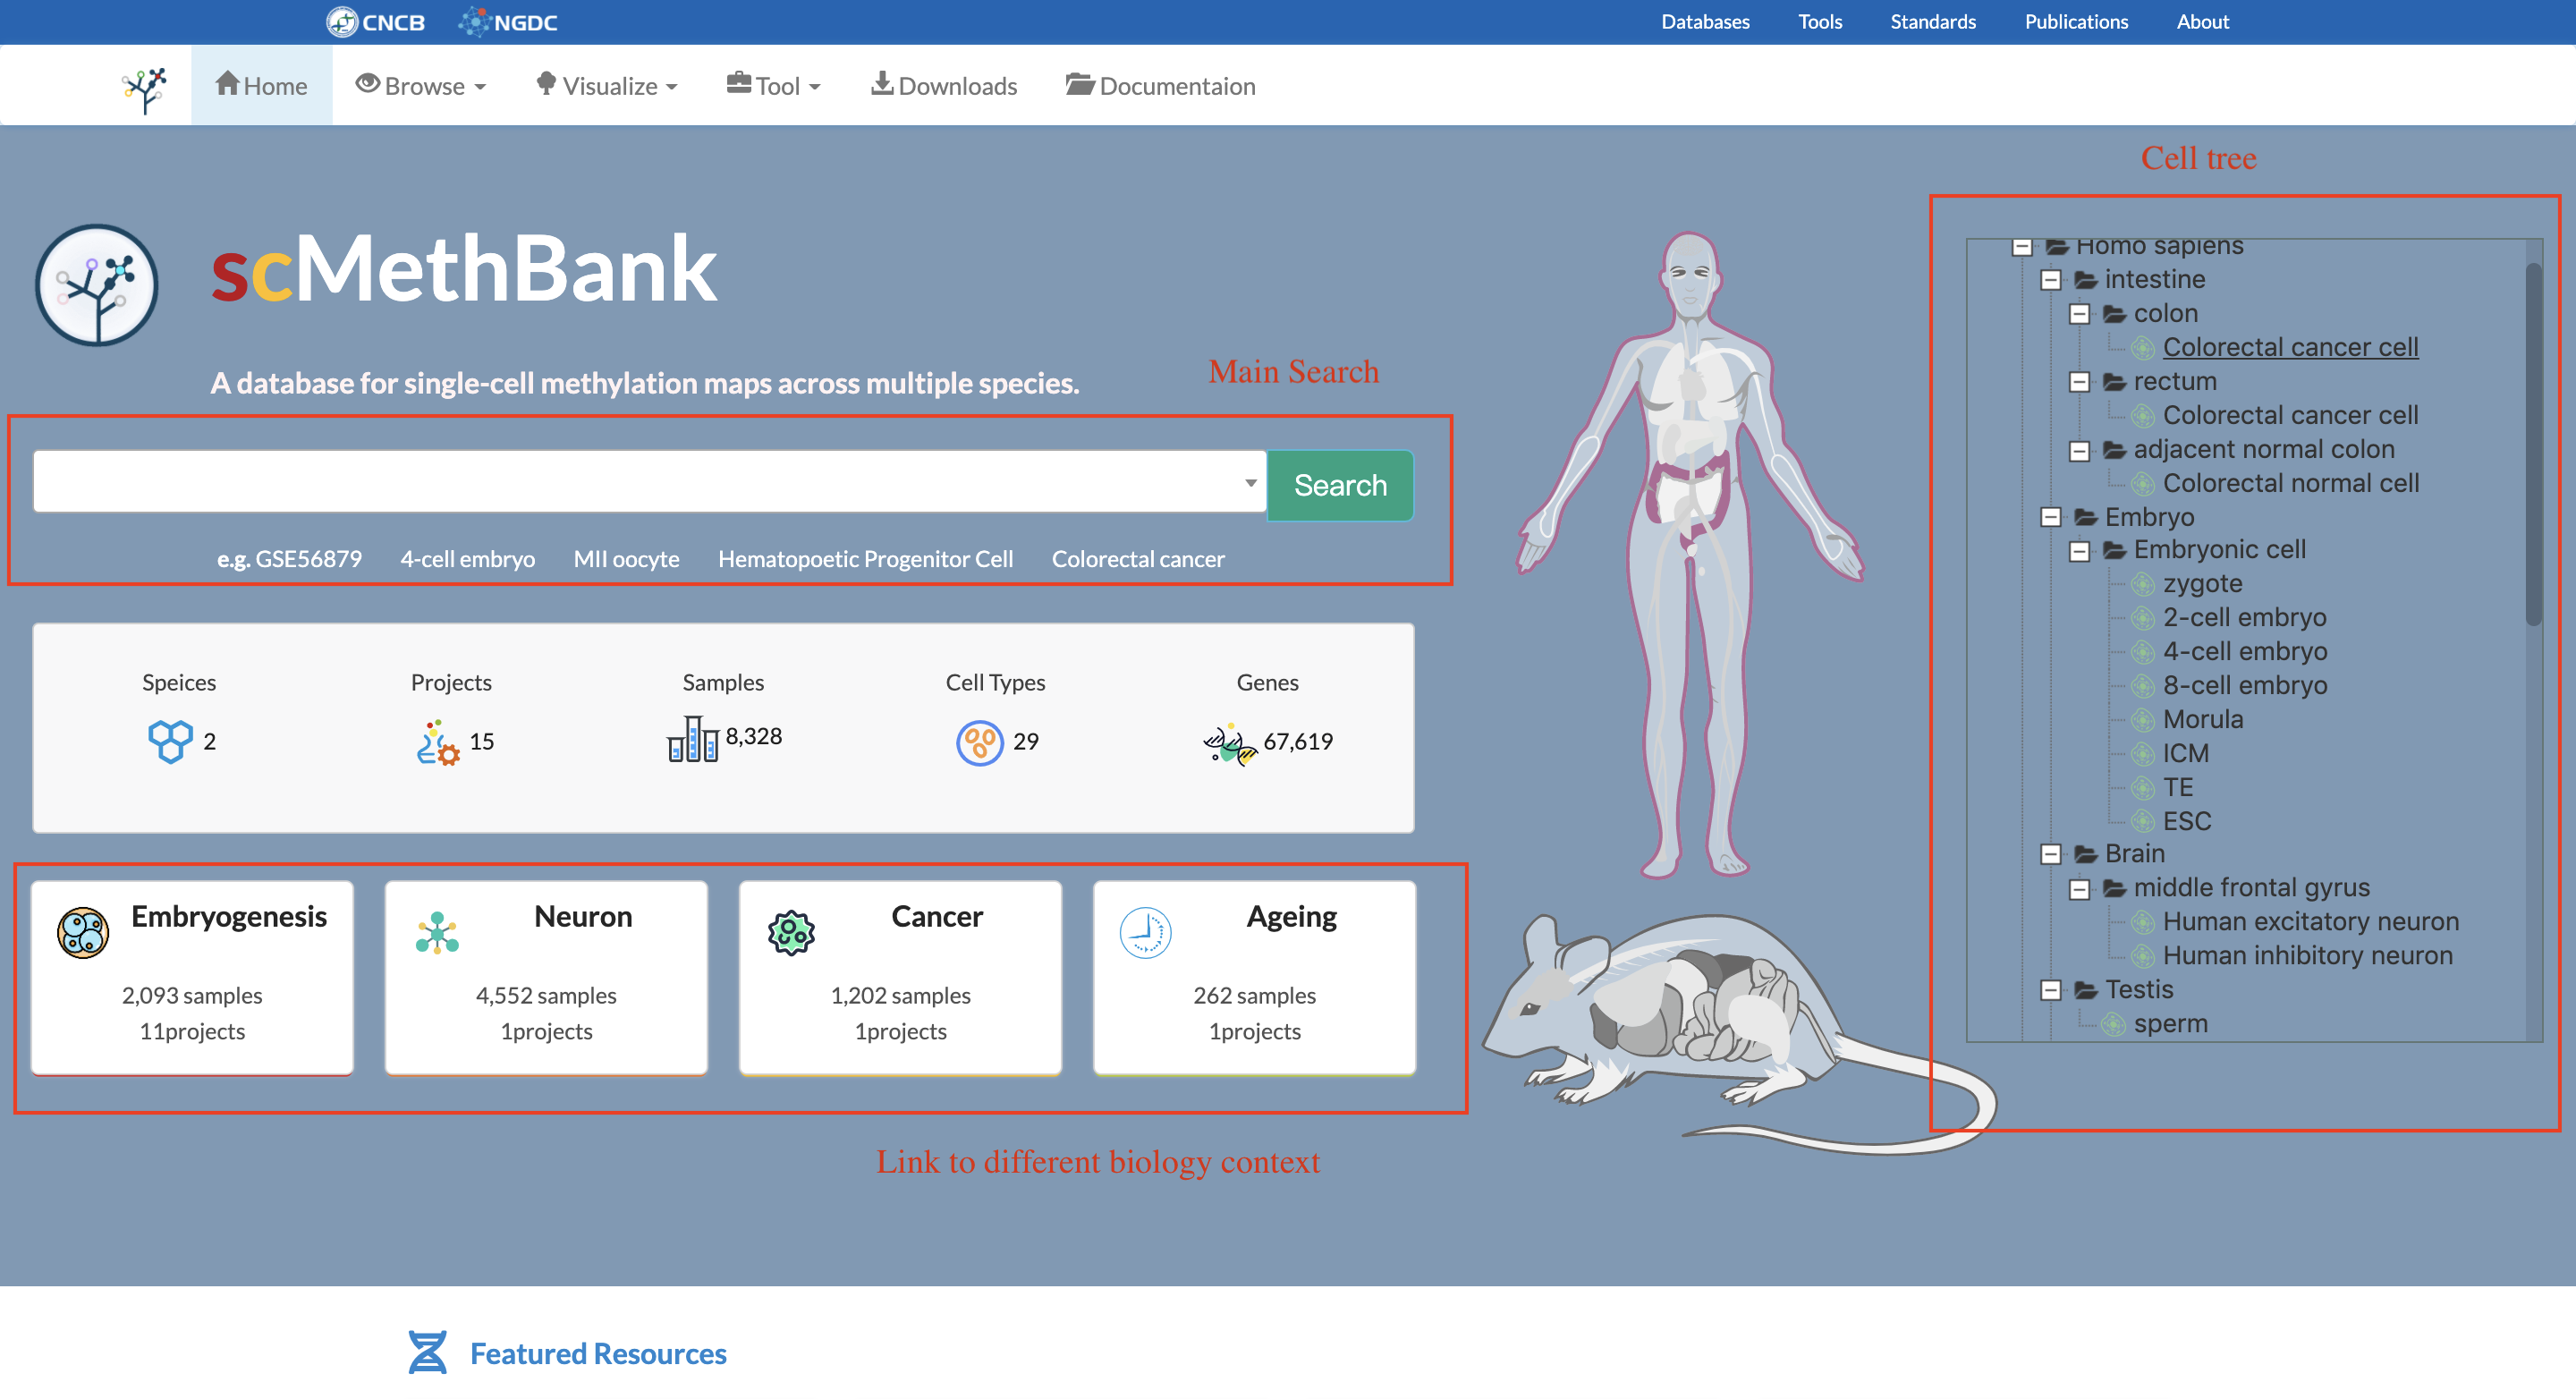
3.1 Index page
The homepage displays cell types information stored in scMethBank through a tree structure, which are linked to corresponding samples of interest. In addition, users can navigate the whole database through these four featured functions: Browse, Visualize, Tool and Download.
3.2 Browse Samples
The repository page is primarily used for data download. It provides an overview of all samples available in the scMethBank and offers users the basic filter as well as advanced filters for the identification and download of the samples of interests.
The page displays meta information of all samples and provides data download functions. The visible part of the table row contains the major meta information of the data, including ID, cell-type and other information specific to the sample. Clicking the plus button will enable the browse of detailed technical information of the sample, including conversion efficiency, overlay reading and so on. Another function is data filtering – users can click hyperlinks in the table to filter samples by the term. And clicking the selected terms in the blue box above the table will unselect the filtering term.
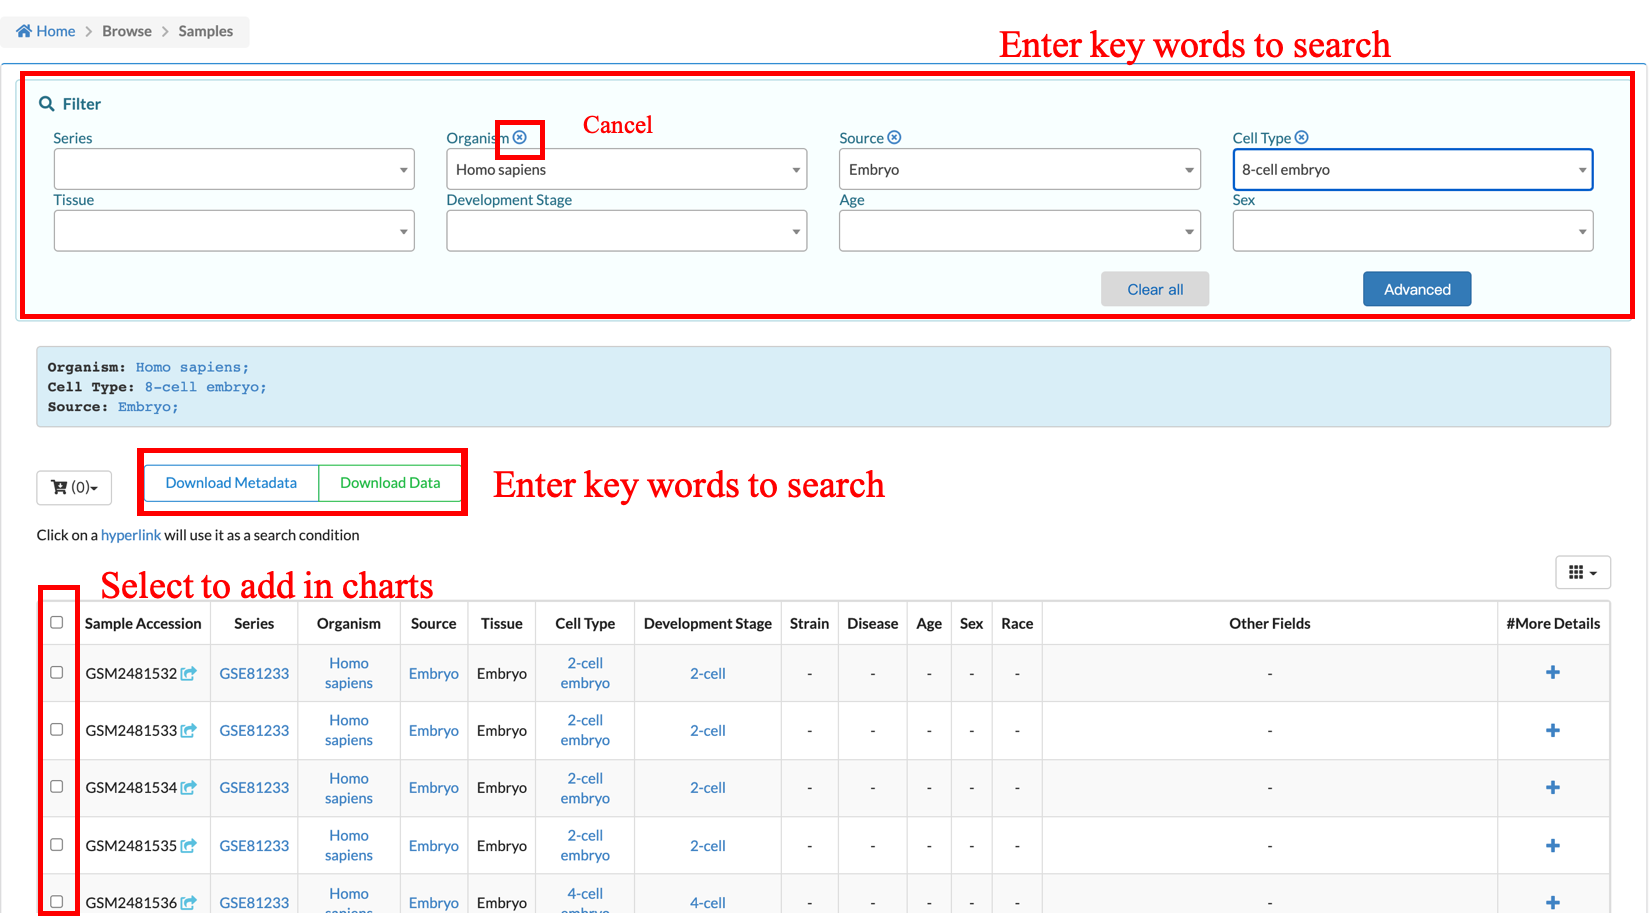
While browsing the repository page, samples can be collected to the sample cart and downloaded as a package. Clicking on the checkbox to the left of a sample will add the sample to the download cart. The cart is limited to **100** files.
For the data selected, users can download data and metadata with the buttons above. File of metadata:** The file of metadata contains metadata related to samples in the cart in **CSV** format. File of methylation level data:** The bed files of samples in the cart are automaticallypackaged into one single compressed (.zip) file.
3.3 Browse Genes
The gene page provides basic information and average methylation level of all the samples included oninvolving genes that users are interested in.
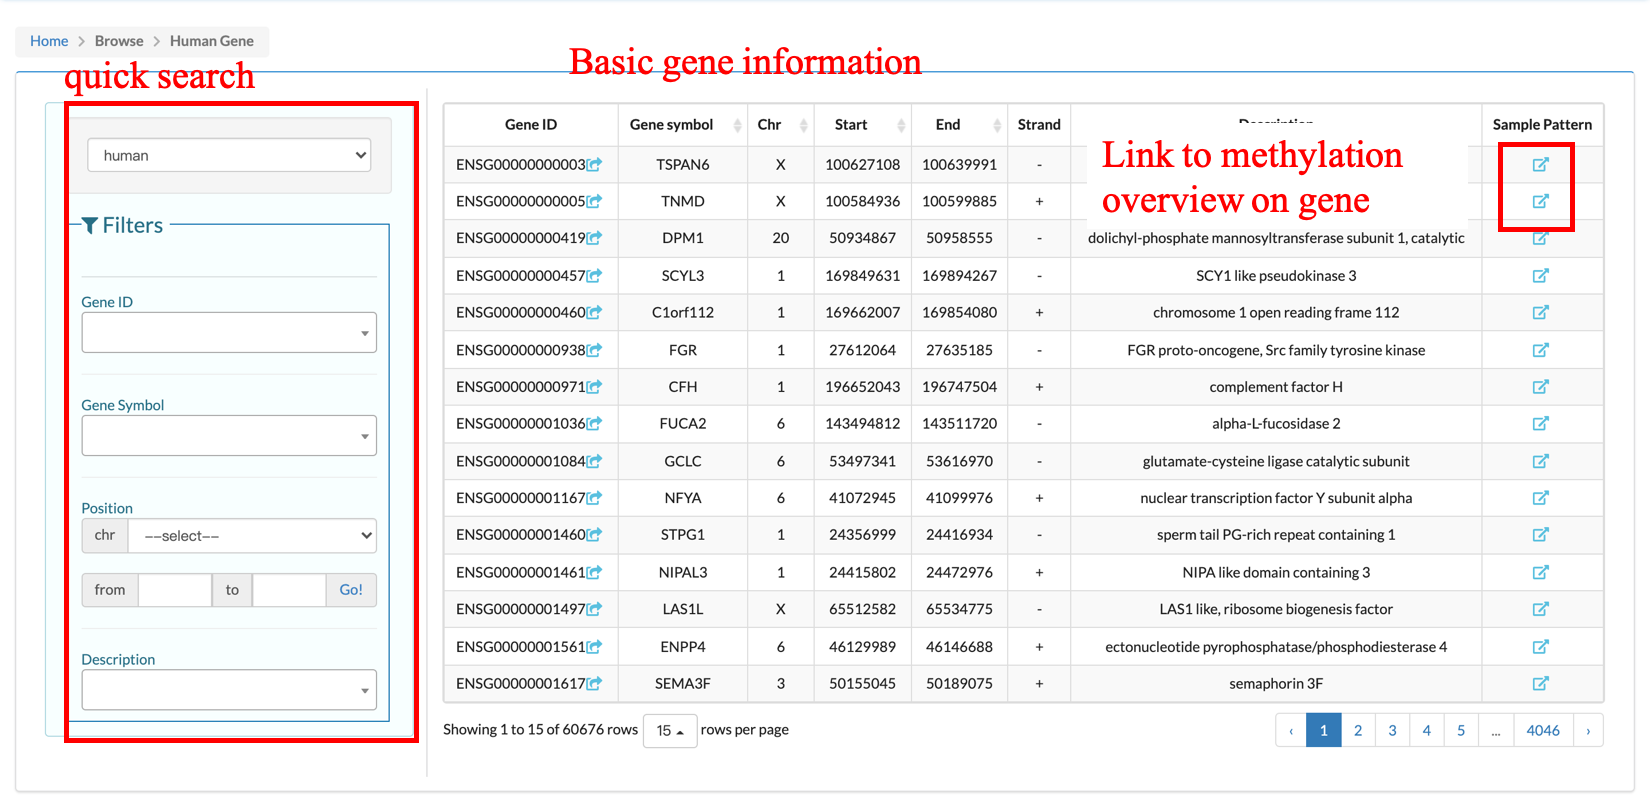
Through the search box on the left, users can screen for any gene they are interested in and jump to the methylated page for that gene via a link to the page.The page provides a boxplot of the mean methylation levels of all the cells covering the gene in the data, along with a table of the original data.

In addition, we embedded a Genome Browser in the page for users to directly browse the position of the gene on the Genome, and users can check the sample of interest to browse the methylation situation of a single sample, where the number 1 is displayed below the methylated site, and the number 1 is not displayed for the unmethylated site
3.4 Browse DMRs
The DMR page shows users the situation of the differential methylation regions among different types of cells in some data sets in the database. We have made a preliminary analysis here, and the specific calculation method is carried out according to the method section of Single-cell multiomics sequencing and analyses of human colorectal cancer. Science 2018 Nov 30;362(6418):1060-1063..

Users may select the database data sets and two types of cells to browse the differences in the methylation, mainly including DMR in the distribution of chromosome, genome element enrichment comments, GO and KEGG result.The page also provides an available for users to download the form,It contains information about the differentially methylated regions analyzed, the genes associated with them, and the genomic elements annotated
3.5 Browse Projects
This page provides the basic information of all the research articles included in the database and the data set corresponding to the articles. In the table displayed on the page, users can browse all the samples in the project following the datasets links. In addition, by clicking the visualization button in the rightmost column, users can find the t-SNE plot of the dataset and see the sample distribution.

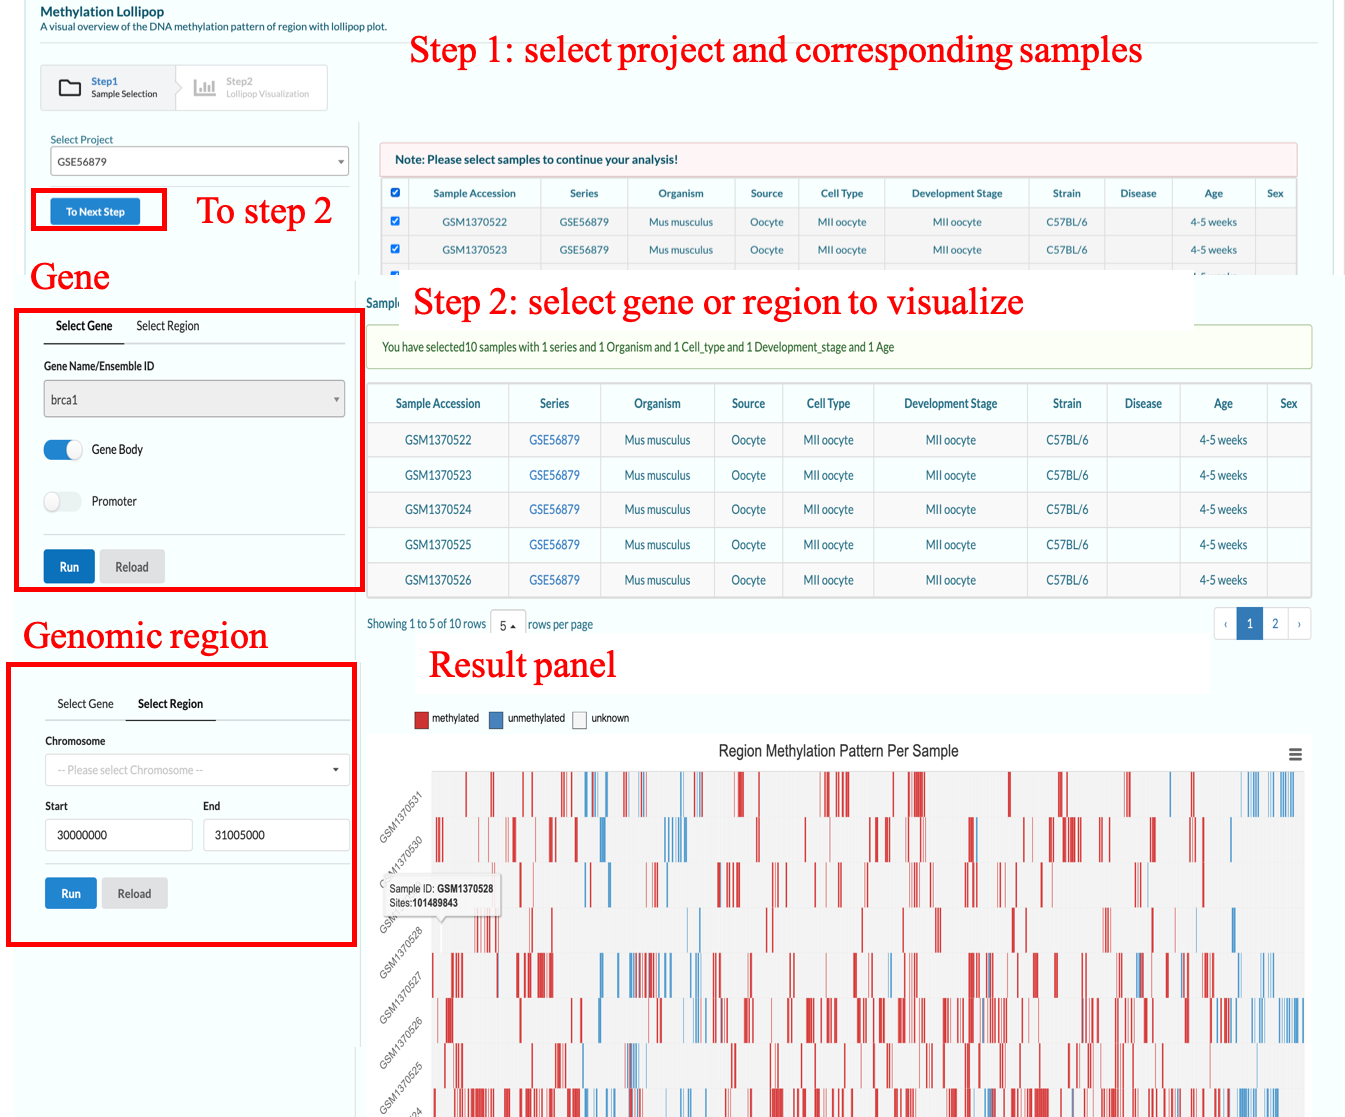
3.6 Region visualization
we store a huge amount of genome-wide CpG methylation data with single-base precision and conducted search optimization of for all the collected samples, hence uUsers can search any interested genes or genome regions of interest in just a few seconds. Here we provide both heatmap form for global methylation patterns and lollipop form that focuses on single CpG sites.


3.7 Cell cluster visualization
By clicking the visualization button of the dataset, you will enter the corresponding t-SNE display page. A tile-based method was applied to bin consecutive genomic windows with a fixed length to facilitate comparison across samples. The default window size is 1000bp, users can customize the window size and draw their t-SNE plot **via the plot button**. Points in the graph will be colored according to cell types by default, and you can re-color them by other conditions selecting in the drop-down box. Move the mouse to a point in the t-SNE diagram, and the coordinate of the sample and its meta information will be displayed.

3.8 Download
The Download Page provides Two ways to download the **BED** files
The ftp url is convenient for advanced user to download Bed files by Sample Accession.
We have packaged some batch files by cell type and orgainsm,you can directly download the tar.gz file by click the corresponding link.
Tools
4.1 DMR Annotation
Differential methylation region is one of the important biological information in methylation analysis, and establishing the relationship between methylation and genome function is very important for downstream analysis.
There are two kinds of input designed for different situations:
-DMR list: Users can paste the DMR list to the text box directly. The file is in standard bed format and has at least 3 column
where each DMR area is a row, and each column must be separated by tab '\t'.
- Job ID: scMethbank assign a unique ID for each analysis and this ID can be used to get results after analyzing.

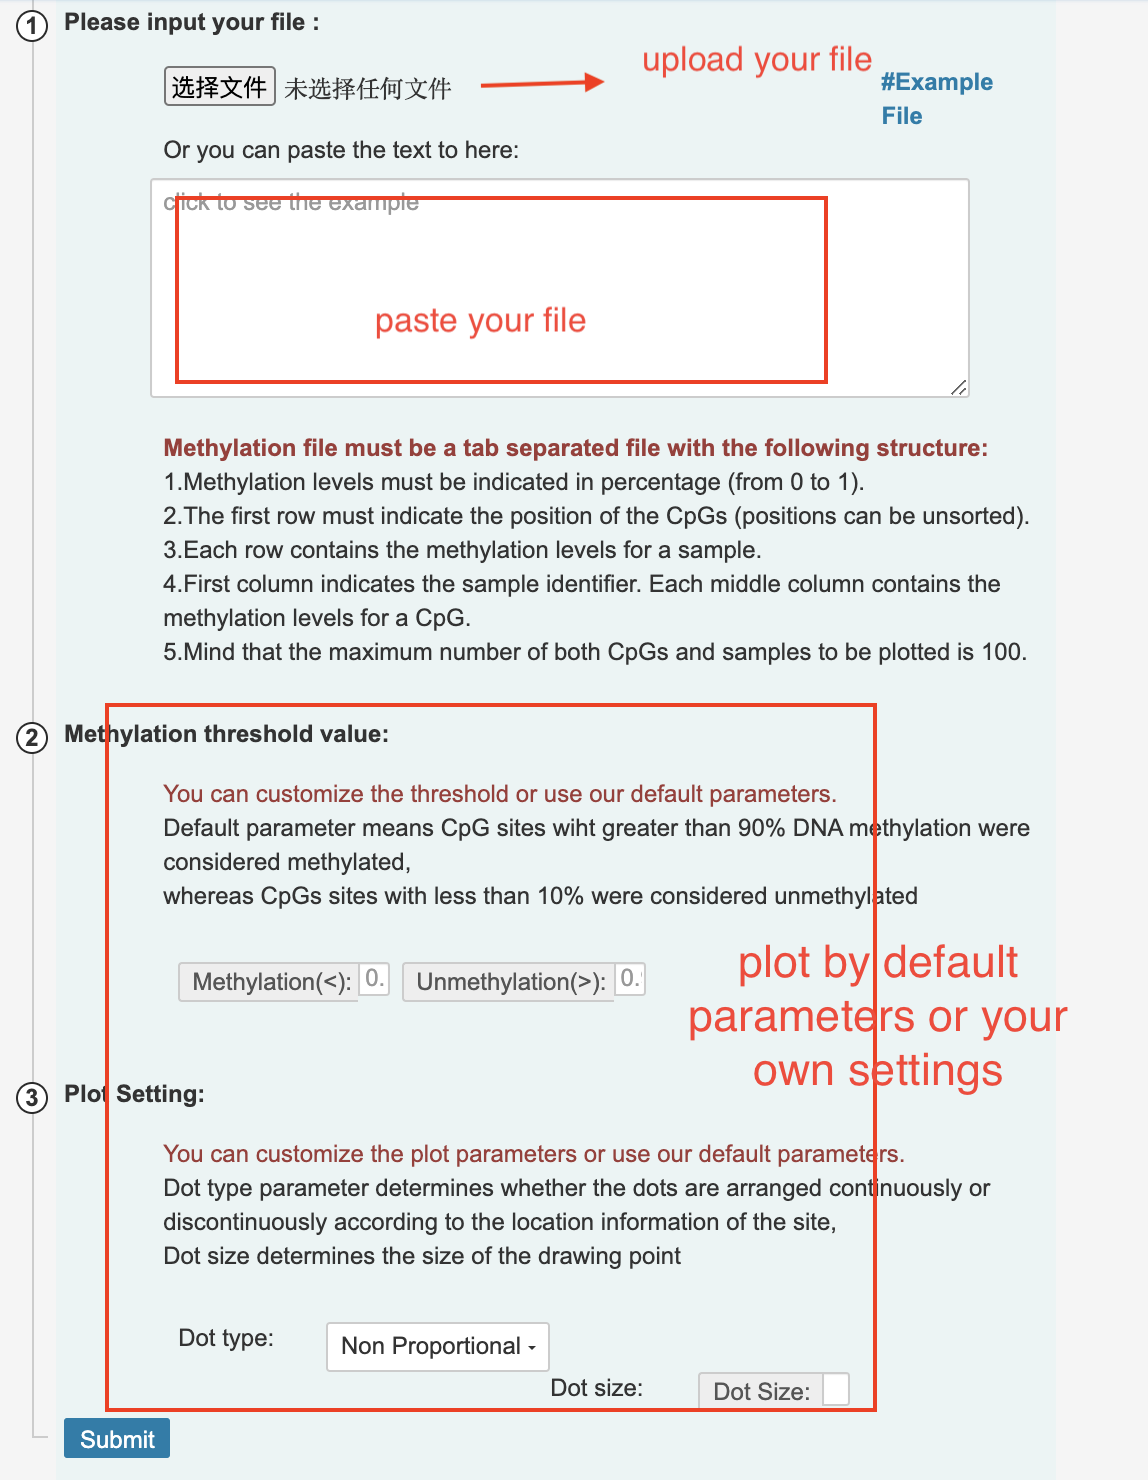
4.2 Lollipop Plotter
Here we provide a web tool for visualizing the single-cell methylation mode. By inputting or uploading your own data file, you can draw a lollipop-like methylation map information, which will help users to display the methylation mode of their own samples, and to discover of differential methylation patterns in the specified area.
Using the tool only requires two steps: first, upload or paste the file in the specified format; second, input parameters or use our default parameters for drawing, the parameters include the threshold of methylation and non-methylation level, the size of the dots and whether to follow proportion of loci on the genome.
Taking the reference file as an example, after uploading, we select the default parameters, that is, more than 0.9 as methylation sites, less than 0.1 as unmethylated sites, and non-equal display, we can get the sample in the site area methylation state diagram, black dots represent methylation, white dots represent non-methylation, x represents uncovered sites.
Contact Us
zongwenting2018m@big.ac.cn
lirj@big.ac.cn
Postal Address
The scMethBank Team
National Genomics Data Center
China National Center for Bioinformation / Beijing Institute of Genomics, Chinese Academy of Sciences
No.1 Beichen West Road
Chaoyang District, Beijing 100101
China